Example: Yield Conversion and Selectivity (YCS) Calculation
This example shows how the Conversion/Yield/Selectivity of a compound (or conserved pseudocompound) is calculated for special situations. These special situations include:
YCS Calculations for Compounds belonging to Equilibrated Reactions
- Compounds that belong to equilibrated reactions
- PFR reactor with recycle
If you are not familiar with the quasi-equilibrium model in REX, you may review the Reactions at Quasi-Equilibrium example before continuing.
To better follow this explanation, please import the YCS_Example.rex file located in the Optience Corporation\REX Suite\REX Examples folder of your installation directory. This file has a simplified Methanol to Olefins model on a fixed bed reactor. In particular, we have Methanol (MeOH) and Dimethyl ether (DME) controlled by an equilibrated reaction:
There is one set included in Estimation → Experiments, that has 1 mmol/h feed of Methanol and Ethylene, 5 mmol/h of Water and no Dimethyl ether. After simulating this set, we obtain these profiles for the compounds related to the equilibrated reaction:
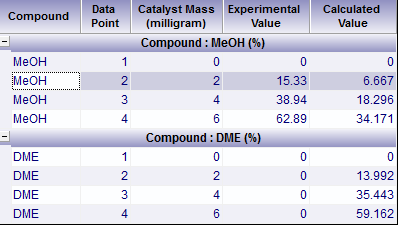
We see that the reactor entry composition for the experiment is not the same as the simulated values. The reason is that entry composition is adjusted to equilibrium values: some Methanol is instantaneously consumed by R1 reaction to produce DME and Water. The experimental and calculated values at the datapoints are below:
As shown above, the experimental feed of 1 mmol/h of Methanol is reduced to 0.52759 mmol/h, while DME and H2O feed increases by 0.2362 mmol/h so to satisfy reaction R1 equilibrium composition.
Lets now calculate the conversion of species, that is given by:
We have two series of data for the species: Experimental and Calculated. Thus we have two conversion calculations:
The Experimental Conversion for MeOH at the second datapoint is obtained by using ITot(MeOH) = 1 mmol/h (the experimental feed value) and OTot(MeOH) = 0.8467 mmol/h (the experimental value at the second datapoint). Thus:
On the other hand, the Calculated Conversion uses the calculated equilibrated value of MeOH as the initial amount. Thus, ITot(MeOH) = 0.52759 mmol/h and OTot(MeOH) = 0.49242 mmol/h:
Let us now consider DME.
In this case, the initial experimental value ITot(DME) is zero, so all Experimental Conversion values are considered zero. Otherwise, a zero division would result from the conversion formula.
Calculated Conversion for DME uses the nonzero initial amount of 0.2362 mmol/h. Thus, calculated DME conversion at datapoint = 2 is given by:
You may review the values at other points, provided in the Results → Yield - Conversion node:
The same principles described above are also used for Yields and Selectivities.
Another interesting demonstration of the calculations above can be seen by including the set MeOH0+DME05 in the Experiments node. This set is same as set MeOH1-DME, except that:
YCS Calculations for Recycle Reactor
To better follow this explanation, please import the YCS_Example.rex file located in the Optience Corporation\REX Suite\REX Examples folder of your installation directory. This file has a simplified Methanol to Olefins model on a fixed bed reactor. In particular, we have Methanol (MeOH) and Dimethyl ether (DME) controlled by an equilibrated reaction:

|
|---|
There is one set included in Estimation → Experiments, that has 1 mmol/h feed of Methanol and Ethylene, 5 mmol/h of Water and no Dimethyl ether. After simulating this set, we obtain these profiles for the compounds related to the equilibrated reaction:

|
|---|
We see that the reactor entry composition for the experiment is not the same as the simulated values. The reason is that entry composition is adjusted to equilibrium values: some Methanol is instantaneously consumed by R1 reaction to produce DME and Water. The experimental and calculated values at the datapoints are below:

|
|---|
As shown above, the experimental feed of 1 mmol/h of Methanol is reduced to 0.52759 mmol/h, while DME and H2O feed increases by 0.2362 mmol/h so to satisfy reaction R1 equilibrium composition.
Lets now calculate the conversion of species, that is given by:
- C(i) = 100 * (ITot(i) - OTot(i)) / ITot (i)
We have two series of data for the species: Experimental and Calculated. Thus we have two conversion calculations:
- Experimental Conversion - obtained using experimental values
- Calculated Conversion - based on calculated values
The Experimental Conversion for MeOH at the second datapoint is obtained by using ITot(MeOH) = 1 mmol/h (the experimental feed value) and OTot(MeOH) = 0.8467 mmol/h (the experimental value at the second datapoint). Thus:
- C(MEOH, Pt=2) = 100 (1 - 0.8467) / 1 = 15.33%
On the other hand, the Calculated Conversion uses the calculated equilibrated value of MeOH as the initial amount. Thus, ITot(MeOH) = 0.52759 mmol/h and OTot(MeOH) = 0.49242 mmol/h:
- C(MEOH, Pt=2) = 100 (0.52759 - 0.49242) / 0.52759 = 6.667%
Let us now consider DME.
In this case, the initial experimental value ITot(DME) is zero, so all Experimental Conversion values are considered zero. Otherwise, a zero division would result from the conversion formula.
Calculated Conversion for DME uses the nonzero initial amount of 0.2362 mmol/h. Thus, calculated DME conversion at datapoint = 2 is given by:
- C(DME, Pt=2) = 100 (0.2362 - 0.20315) / 0.2362 = 13.99 %
You may review the values at other points, provided in the Results → Yield - Conversion node:
|
|---|
The same principles described above are also used for Yields and Selectivities.
Another interesting demonstration of the calculations above can be seen by including the set MeOH0+DME05 in the Experiments node. This set is same as set MeOH1-DME, except that:
- MeOH feed is zero instead of 1 mmol/h
- DME feed is 0.5 mmol/h instead of zero to preserve same total Carbon
- H2O feed is 5.5 mmol/h instead of 5 mmol/h
- Calculated Conversion is same in both sets: That is in accordance with having same calculated values for all compounds in both sets
- Experimental Conversion is different. The reason is that the experimental feed condition is different
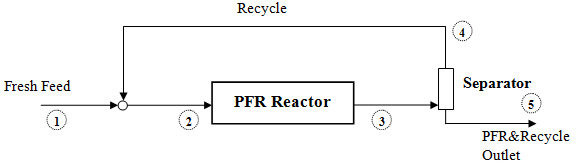
The basics of recycle reactor models can be understood from the PFR Reactor with Recycle example. In order to follow this example, please import the YCS_Example.rex file located in the Optience Corporation\REX Suite\REX Examples folder of your installation directory. After importing, you must enable the Recycle option in Reactor node and then run the project.
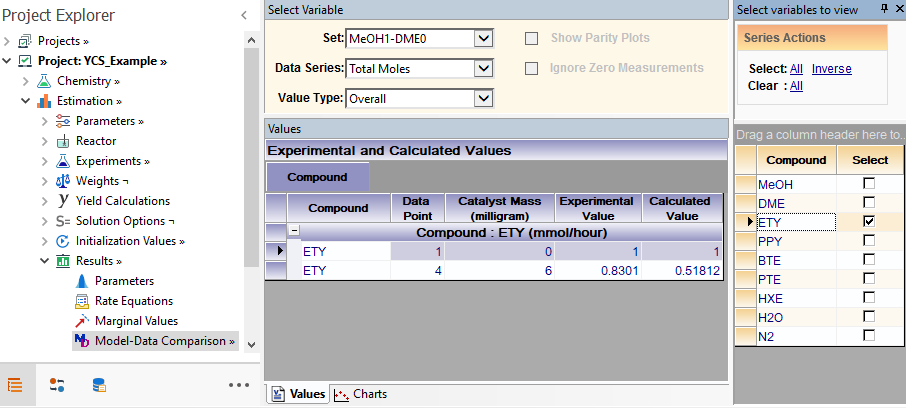
In the Experiments → Recycle node, you will see a 90% recycle of Methanol, Dimethyl ether and Ethylene. We will focus on the conversion of Ethylene from now on. Nevertheless, the description below applies to any compound including those that belong to equilibrated reactions.
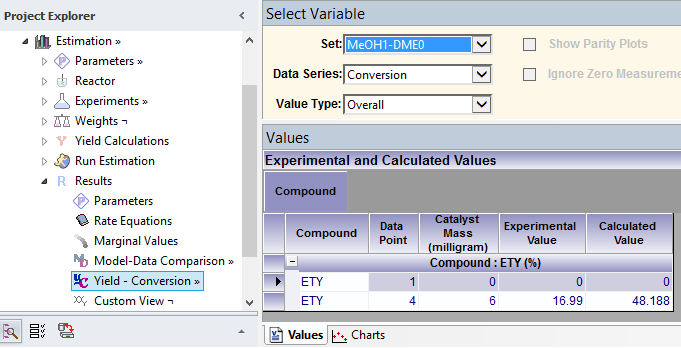
In the Model-Data Comparison node, please select ETY compound and Value Type= Overall. Below are the Values and Chart you will get:
The data shown belongs to the streams indicated with and
and  in the schematic from the PFR Reactor with Recycle example.
As shown in the previous section, Overall Conversion is given by:
In this example, the Experimental Conversion for ETY at the outlet datapoint is obtained by using ITot(ETY) = 1 mmol/h (the experimental feed value) and OTot(ETY) = 0.8301 mmol/h. Thus, the reported value in Results → Yields - Conversion node is:
As for the calculated conversion, the overall feed is 1 mmol/h and the outlet is 0.51812 mmol/h thus the reported conversion is 48.188%:
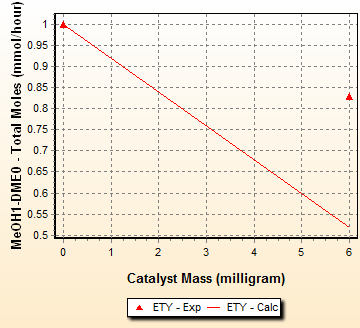
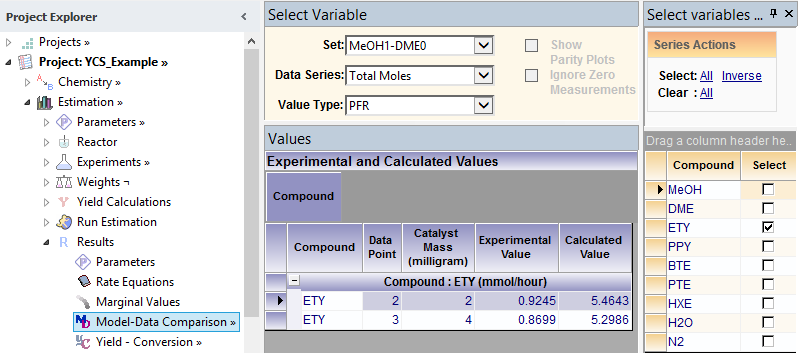
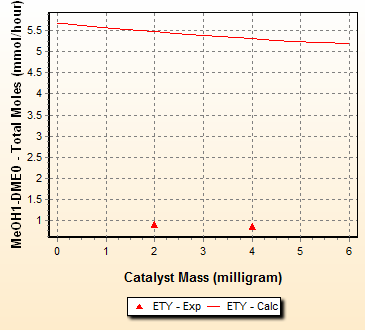
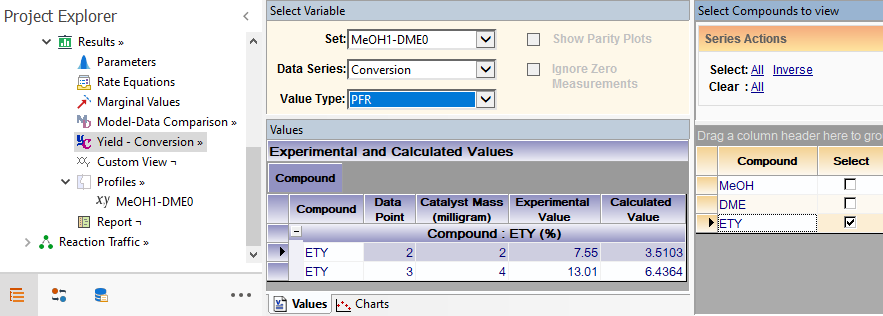
Now we inspect the Type = PFR values in Model Data Comparison node, that represent the composition inside the reactor, from to
to  in the schematic.
As we can see in the chart, ETY calculated values are much higher than in the fresh feed, due to the recycle of the species.
Obtaining the ETY experimental conversion is tricky, as there is no experimental value for the point in the schematic. So the conversion is determined by using the experimental value in (fresh feed) as ITot(i). In the example, it is 1 mmol/h. When calculating the experimental conversion in Datapoint=2, then OTot(ETY) = 0.9245 mmol/h, thus:
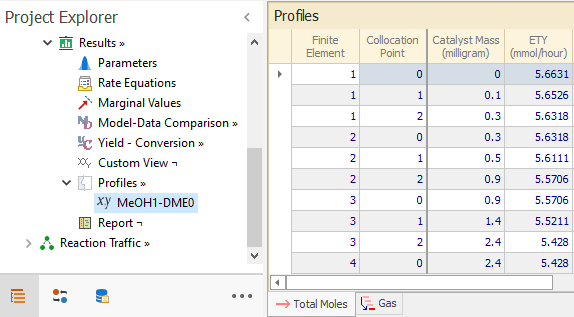
The calculated conversion is obtained based on the calculated ETY value in. The exact figure is not shown in the Values tab of Model Data Comparison node, but in Profiles node: the value ( ITot(ETY) = 5.6631 mmol/h ) is in the first row, that represent the reactor inlet point, that mixes the fresh feed and the recycle streams:
The calculated value at datapoint = 2 ( OTot(ETY) = 5.4643 mmol/h ) is retrieved as before from the Model Data Comparison node. Thus:
The caveat here to remember is that due to the lack of experimental data at the entry of the PFR, the experimental conversion at datapoint = 2 is calculated based on fresh feed values from , so it cannot be directly compared with the calculated values.
Top of Topic
In the Experiments → Recycle node, you will see a 90% recycle of Methanol, Dimethyl ether and Ethylene. We will focus on the conversion of Ethylene from now on. Nevertheless, the description below applies to any compound including those that belong to equilibrated reactions.
In the Model-Data Comparison node, please select ETY compound and Value Type= Overall. Below are the Values and Chart you will get:
|
|---|
|
|---|
The data shown belongs to the streams indicated with
and in the schematic from the PFR Reactor with Recycle example.
|
|---|
As shown in the previous section, Overall Conversion is given by:
- C(i) = 100 * (ITot(i) - OTot(i)) / ITot (i)
In this example, the Experimental Conversion for ETY at the outlet datapoint is obtained by using ITot(ETY) = 1 mmol/h (the experimental feed value) and OTot(ETY) = 0.8301 mmol/h. Thus, the reported value in Results → Yields - Conversion node is:
- C(ETY, Pt=4) = 100 (1 - 0.8301) / 1 = 16.99 %
As for the calculated conversion, the overall feed is 1 mmol/h and the outlet is 0.51812 mmol/h thus the reported conversion is 48.188%:
|
|---|
Now we inspect the Type = PFR values in Model Data Comparison node, that represent the composition inside the reactor, from
to in the schematic.
|
|---|
|
|---|
As we can see in the chart, ETY calculated values are much higher than in the fresh feed, due to the recycle of the species.
Obtaining the ETY experimental conversion is tricky, as there is no experimental value for the
point in the schematic. So the conversion is determined by using the experimental value in (fresh feed) as ITot(i). In the example, it is 1 mmol/h. When calculating the experimental conversion in Datapoint=2, then OTot(ETY) = 0.9245 mmol/h, thus:- C(ETY, Pt=2) = 100 (1 - 0.9245) / 1 = 7.55 %
The calculated conversion is obtained based on the calculated ETY value in
. The exact figure is not shown in the Values tab of Model Data Comparison node, but in Profiles node: the value ( ITot(ETY) = 5.6631 mmol/h ) is in the first row, that represent the reactor inlet point, that mixes the fresh feed and the recycle streams:
|
|---|
The calculated value at datapoint = 2 ( OTot(ETY) = 5.4643 mmol/h ) is retrieved as before from the Model Data Comparison node. Thus:
- C(ETY, Pt=2) = 100 (5.6631 - 5.4643) / 5.6631 = 3.51 %
|
|---|
The caveat here to remember is that due to the lack of experimental data at the entry of the PFR, the experimental conversion at datapoint = 2 is calculated based on fresh feed values from
, so it cannot be directly compared with the calculated values.
Go back to: